Laser Classifier

Elemental classification at single-sample resolution

One micro-laser pulse produces a full elemental spectrum from a single sample. A supervised model turns that spectrum into a class assignment you can act on. Two instruments run the same engine: MicroLIBS™ for high-resolution analytical work, Laser Classifier™ HT for production throughput.

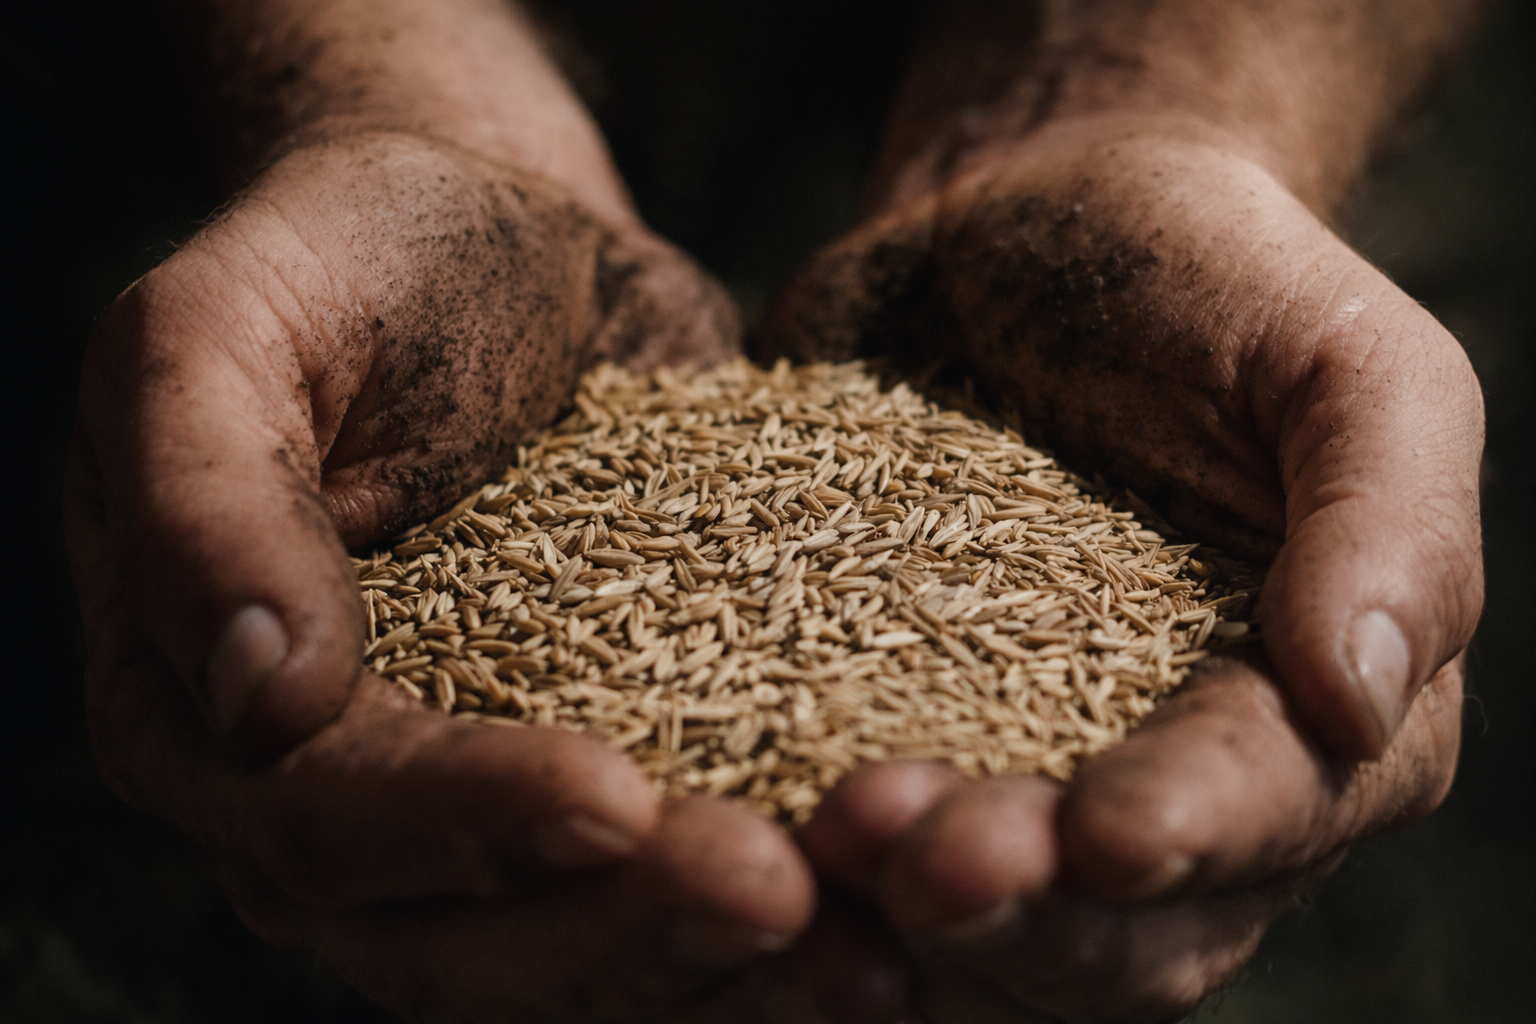
Seeds for elemental analysis

Elemental Signatures → Biological Decisions

We use micro-laser elemental analysis combined with supervised multivariate modeling to convert spectral data into actionable classification outputs. The method is matrix-agnostic. Seed is where we work today, and it is one of several areas the platform already covers.

  • Discriminate genotypes and varieties within a lot
  • Classify individual samples by elemental signature
  • Detect off-types and anomalies no optical method sees
  • Quantify surface elemental distribution
  • Support research, breeding, QC and diagnostic decisions
Laser Spectroscopy
Statistical Modeling
Classification Algorithms
Biological Validation

Where It Is Applied

Genotype Discrimination Off-Type Detection Lot-to-Lot QC Product Authentication Disease Diagnostics Materials & Tissue

Why It Matters

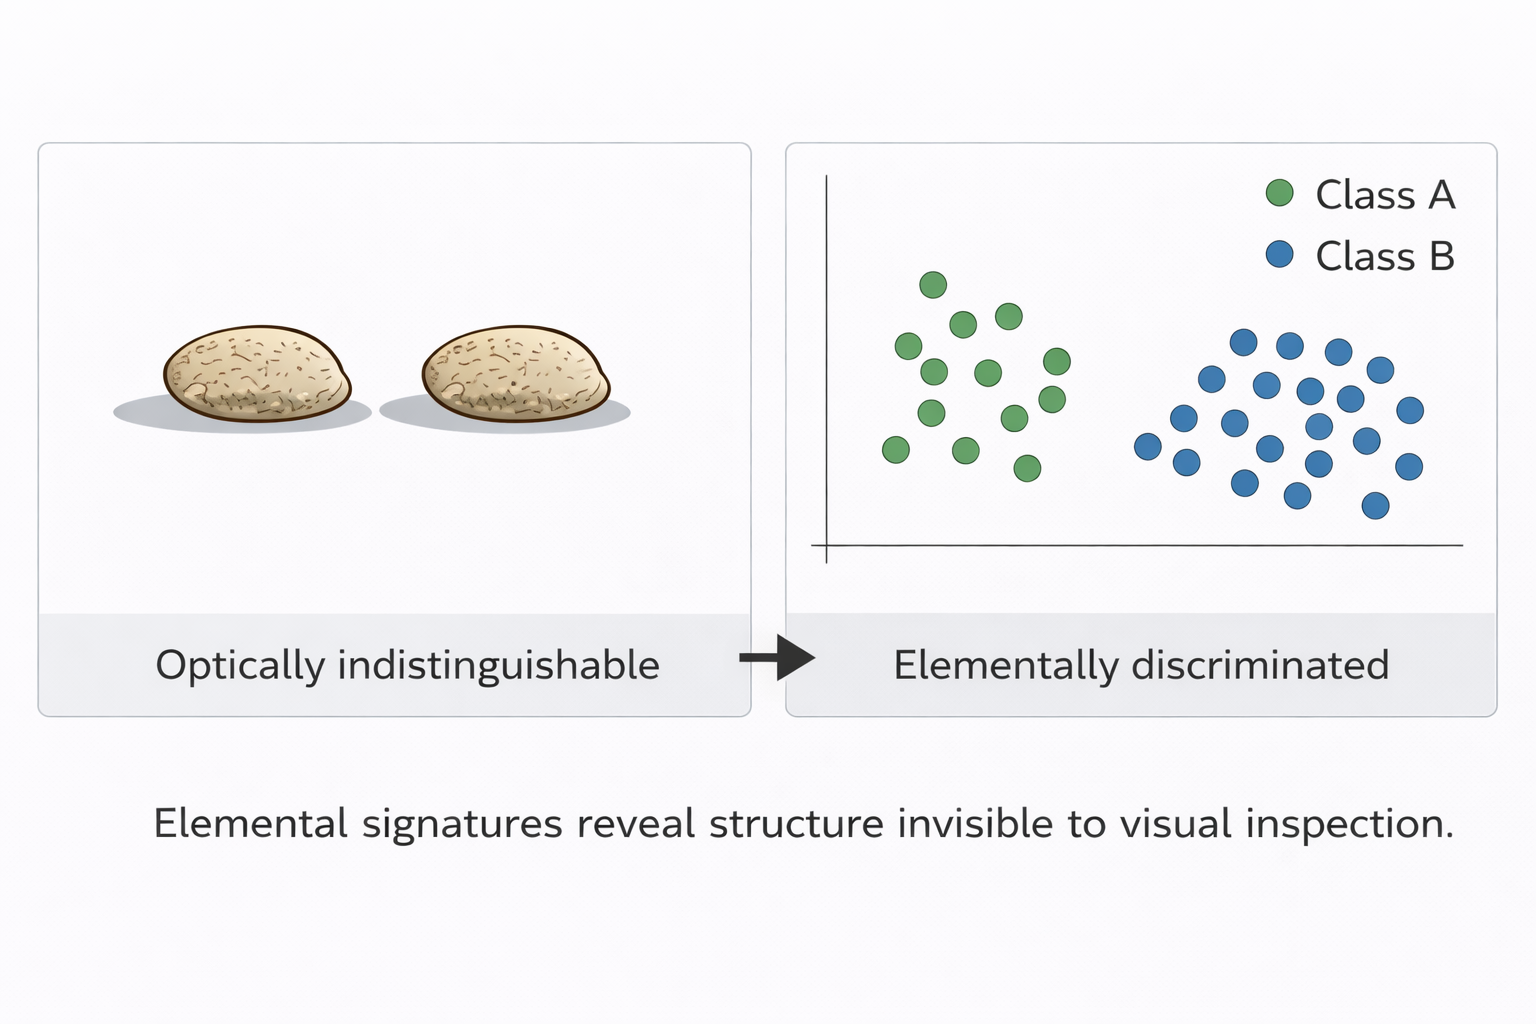
Bulk chemical tests provide averages. Optical inspection evaluates appearance. Neither captures classification at the resolution of the individual sample.

Elemental signatures reveal statistically significant discrimination between classes, within-lot variability, and hidden structure not visible optically. That is what makes an evidence-based go/no-go decision possible.

Individual Seed Analysis for Industrial Decision Support

The Laser Classifier™ platform performs rapid elemental analysis of individual seeds using a single micro-laser pulse per seed. Each seed generates a characteristic elemental signature, processed by a supervised classification model to assign the seed to a defined class.

No imaging No bulk averaging No indirect surrogates Direct seed-level classification
Seed classification analysis

How It Works in Practice

  • One controlled laser pulse per seed
  • Multi-element spectral acquisition
  • Automated spectral preprocessing
  • Supervised model-based classification
  • Class assignment with confidence score

From Seed-Level Results to QC Decisions

  • Proportion of seeds in each class
  • Detection of off-type or anomalous seeds
  • Lot-to-lot comparison
  • Statistical confidence of classification model
  • Defined go/no-go thresholds

Why Seed-Level Classification Matters

Conventional methods, whether chemical or optical, lack single-seed resolution. By operating at the individual seed scale, within-lot variability becomes measurable and decision criteria become quantifiable.

1
Pulse / Seed
< 10 ms
Acquisition Time
4–6w
Pilot Delivery
300+
Seeds per Pilot

One Method, Many Matrices

The classifier does not know what it is looking at. It measures elemental emission and a supervised model assigns a class. That is why the same platform has been applied to seed, agricultural products, diseased plant tissue, insect vectors, fossil resin and human tissue.

🌾
Validated in pilot

Off-Type Screening and Lot QC

Quantify the fraction of off-type or anomalous seed in a lot, compare lots against a reference model, and set decision thresholds that are statistical rather than visual.

Run on customer material under commercial agreement.

🧬
In development

Ploidy Discrimination in Single Seed

Elemental discrimination of genome dosage in intact seed, aimed at breeding programs that need ploidy state early and without consuming the seed. Internal feasibility and proof-of-concept work is active.

Provisional patent filed June 2026. Not yet offered as a service.

Peer-reviewed

Agricultural Product Authentication

Variety and geographic origin from elemental signature. Arabica separated from Robusta in coffee, and quality control plus origin identification in handmade cigars.

Optics and Photonics Journal 2017; Applied Optics 2015.

🍊
Peer-reviewed

Plant Disease and Insect Vector Diagnostics

Huanglongbing-infected citrus identified from phloem samples, and bacterial infection detected inside the insect vector itself. Two different biological matrices, same supervised pipeline.

Applied Optics 2018; Scientific Reports 2019.

💎
Peer-reviewed

Materials and Geological Classification

Classification of amber samples by LIBS combined with chemometric methods. Evidence that the approach is not limited to living tissue.

Revista Cubana de Fisica 2023.

🔬
Peer-reviewed

Biomedical Tissue Discrimination

Fast detection of prostate malignant tissue using multipulsed LIBS. The most demanding classification problem the group has published, and the clearest proof that the method generalizes.

Revista Cubana de Fisica 2022.

Six domains, one measurement principle and one modeling approach. The published record behind each of these is in Scientific Foundation below.

How It Works

From sample intake to classification output, traceable at every step.

Step 01
🌱
Seed Handling & Traceability
Seeds logged and tracked individually. No bulk pooling or averaging.
Step 02
Single-Pulse Elemental Acquisition
Micro-laser pulse generates transient plasma with multi-element spectral data.
Step 03
📊
ProLIBSpector™ Processing
Signal normalization, feature extraction, and supervised model application.
Step 04
Classification & QC Output
Class label + confidence score. Lot-level go/no-go threshold.
Step 01 — Seed Handling

Individual Traceability

Seeds are logged and tracked under controlled conditions. Each seed is evaluated individually, so every classification result corresponds to a specific seed.

Step 02 — Laser Acquisition

Elemental Signature Capture

A precisely controlled micro-laser pulse interacts with the seed surface, generating a transient plasma emission with multi-element spectral information.

  • Single pulse per seed
  • No chemical reagents
  • Minimal preparation
  • Rapid acquisition
Step 03 — Processing

Spectral Processing & Classification

Raw spectral data are processed using ProLIBSpector™, performing signal normalization, feature extraction, supervised model application, and class assignment with confidence scores.

Step 04 — Aggregation

Statistical Aggregation & QC Metrics

  • Class proportions
  • Variability indicators
  • Lot-to-lot comparison metrics
  • Defined decision thresholds

Transforms analytical data into structured decision support.

LIBS Classifier Workflow

Pilot Studies

  • Off-site analytical evaluation
  • Model development and validation
  • Performance report

Long-Term Integration

  • Dedicated laboratory system
  • Workflow integration
  • Model updating
  • Training and support

Two Systems, One Platform

Both instruments run ProLIBSpector™ and produce the same class outputs from the same supervised models. What differs is how a sample gets in front of the laser, and how many samples per hour that allows.

MicroLIBS Analysis System

High spatial resolution

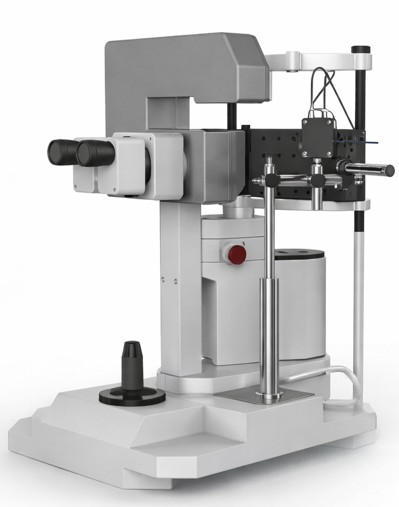
MicroLIBS™ Analysis System

High spatial resolution single-sample analysis. Built for micro-analytical work where position on the sample matters: embryo-level measurement, sub-seed tissue mapping, and protocol development.

Sample handling
Manual, sample by sample positioning under the objective.
Measurement rate
On the order of one sample per second, positioning included, since the operator places each sample by hand.
Software
ProLIBSpector™
Status
Operational
Best for
Feasibility studies, protocol optimization, embryo and tissue-specific work, research collaborations.
Note
This is the system used in every pilot study to date and in all of the published research listed below.
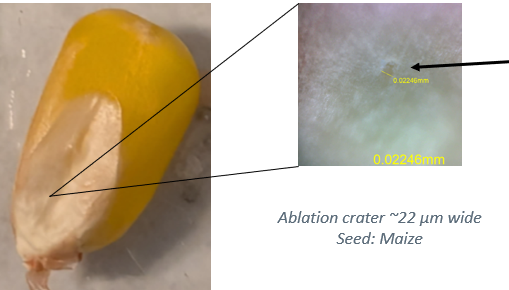
Maize kernel with a magnified view of the ablation crater, measured at about 22 micrometres wide
Where the pulse lands is chosen by the operator. That control is the whole point of the high-resolution stage, and it is what embryo-level and tissue-specific work depends on.
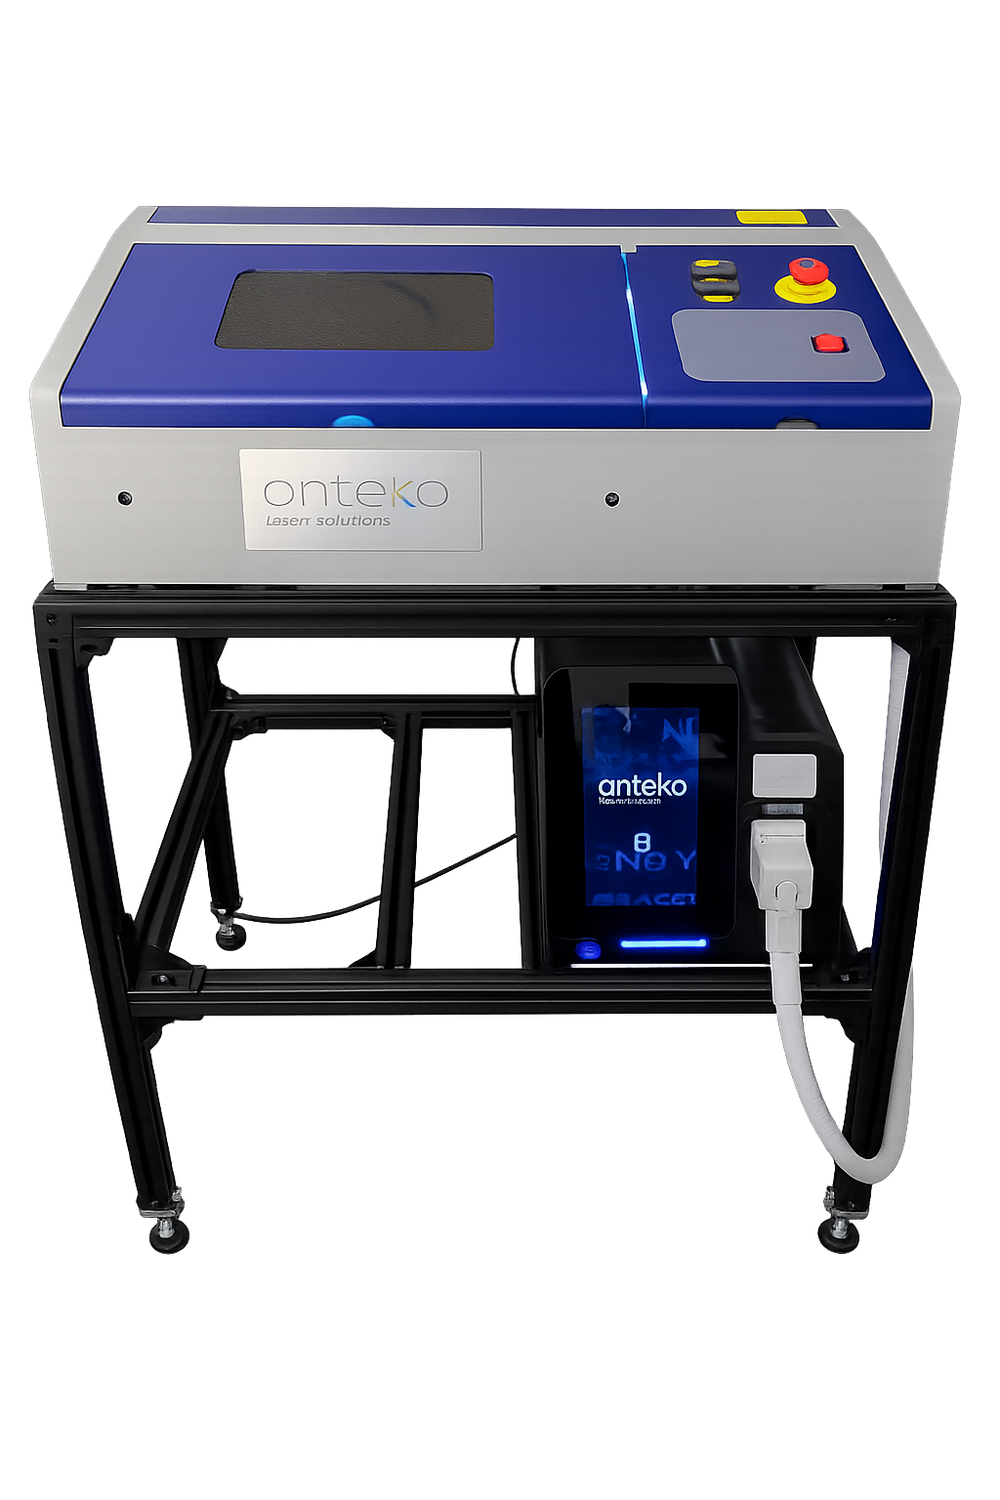
Laser Classifier HT automated system

Production throughput

Laser Classifier™ HT

Automated platform for production-scale classification. Samples are loaded in standard SBS plates, one sample per well, and the stage indexes through them without individual handling.

Sample handling
Standard SBS plate format, one sample per well. The stage accepts different plate types, so well count and geometry can follow the program rather than the instrument.
Measurement rate
10 spectra per second, one spectrum per sample classified. A full 96-well plate is measured in about 10 seconds.
Practical throughput
Set by plate loading, not by the measurement. How fast seed can be singulated into wells depends on its size and shape, so we quote end-to-end throughput per crop rather than as one headline number. Ask us for the figure on yours.
Software
ProLIBSpector™
Status
Operational
Deployment timing discussed per program.
Best for
Lot QC, off-type screening, production-volume classification.
Note
Non-destructive and in situ. No sample preparation, no reagents, no sectioning.
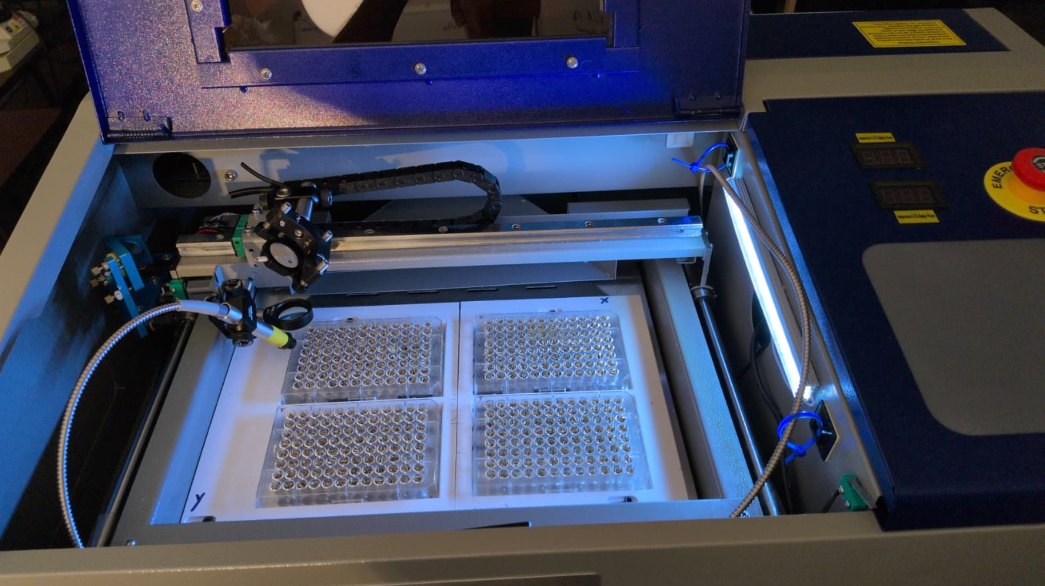
Laser Classifier HT with four seed plates loaded on the stage
Plates loaded on the stage. The format shown here is four plates at a time, and the stage accepts other plate types.
The two are complementary, not alternatives. The usual path is a pilot on MicroLIBS™, where the model gets built and validated on your material and the analytical question gets settled. If the model holds, the same model moves to Laser Classifier™ HT and runs at production volume. Nothing about the measurement changes between the two, which is the point. Pricing for both systems is on request.
Laser Classifier™
The platform. Instruments, software and supervised models together.
MicroLIBS™
The high spatial resolution instrument. Manual positioning.
Laser Classifier™ HT
The automated high-throughput instrument. Plate-based.
ProLIBSpector™
The software. Runs on both instruments and does the classification.

Post-Measurement Viability

The pulse ablates a nanogram-scale volume and the seed stays intact and plantable, which is what makes the measurement usable ahead of planting rather than instead of it. The fair way to show that is at two scales, because the number only means something next to the seed it was made on.

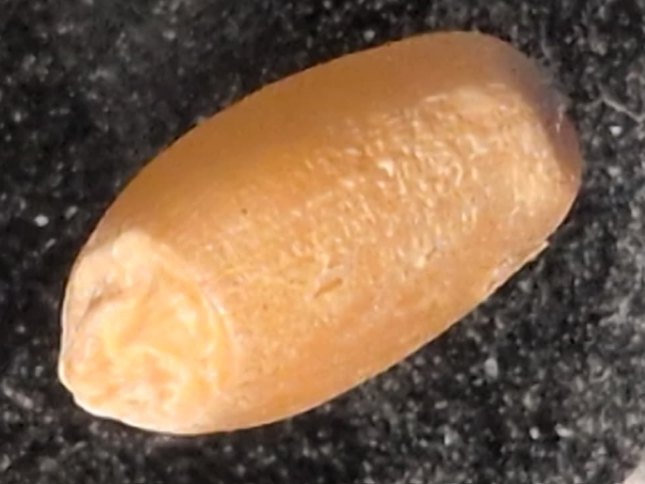
Wheat kernel after measurement, with no damage visible at the scale of the seed
At seed scaleA kernel after measurement. At the scale anyone actually handles seed, there is nothing to see. No sectioning, no reagent, no visible mark, and the seed is still plantable.
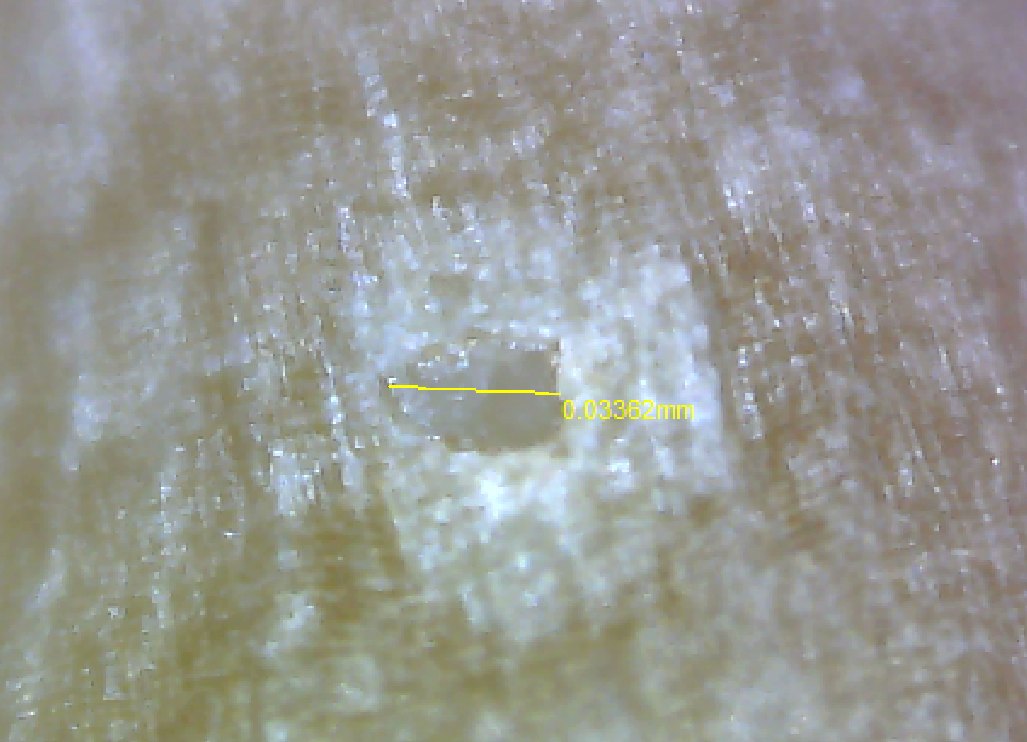
Micrograph of an ablation crater on a seed surface, with the measured width annotated
Under the microscopeThe same site magnified, with the crater width annotated. Finding the mark takes a microscope, and it stays confined to the seed coat. The embryo is not targeted.

LIBS-Based Elemental Surface Analysis

Laser Classifier™ is based on laser-induced breakdown spectroscopy (LIBS), adapted for single-sample surface verification. A focused pulse ablates a nanogram-scale volume, the resulting micro-plasma emits, and the spectrum resolves elemental composition with little or no sample preparation. The platform builds on decades of laser spectroscopy development and classification research by the same group.

Multi-element detection
Spatial resolution
Rapid acquisition
Direct elemental signature
Surface-focused analysis
Non-destructive testing

Advanced Laser Analysis Facility

MicroLIBS Analysis System
MicroLIBS™ Analysis System
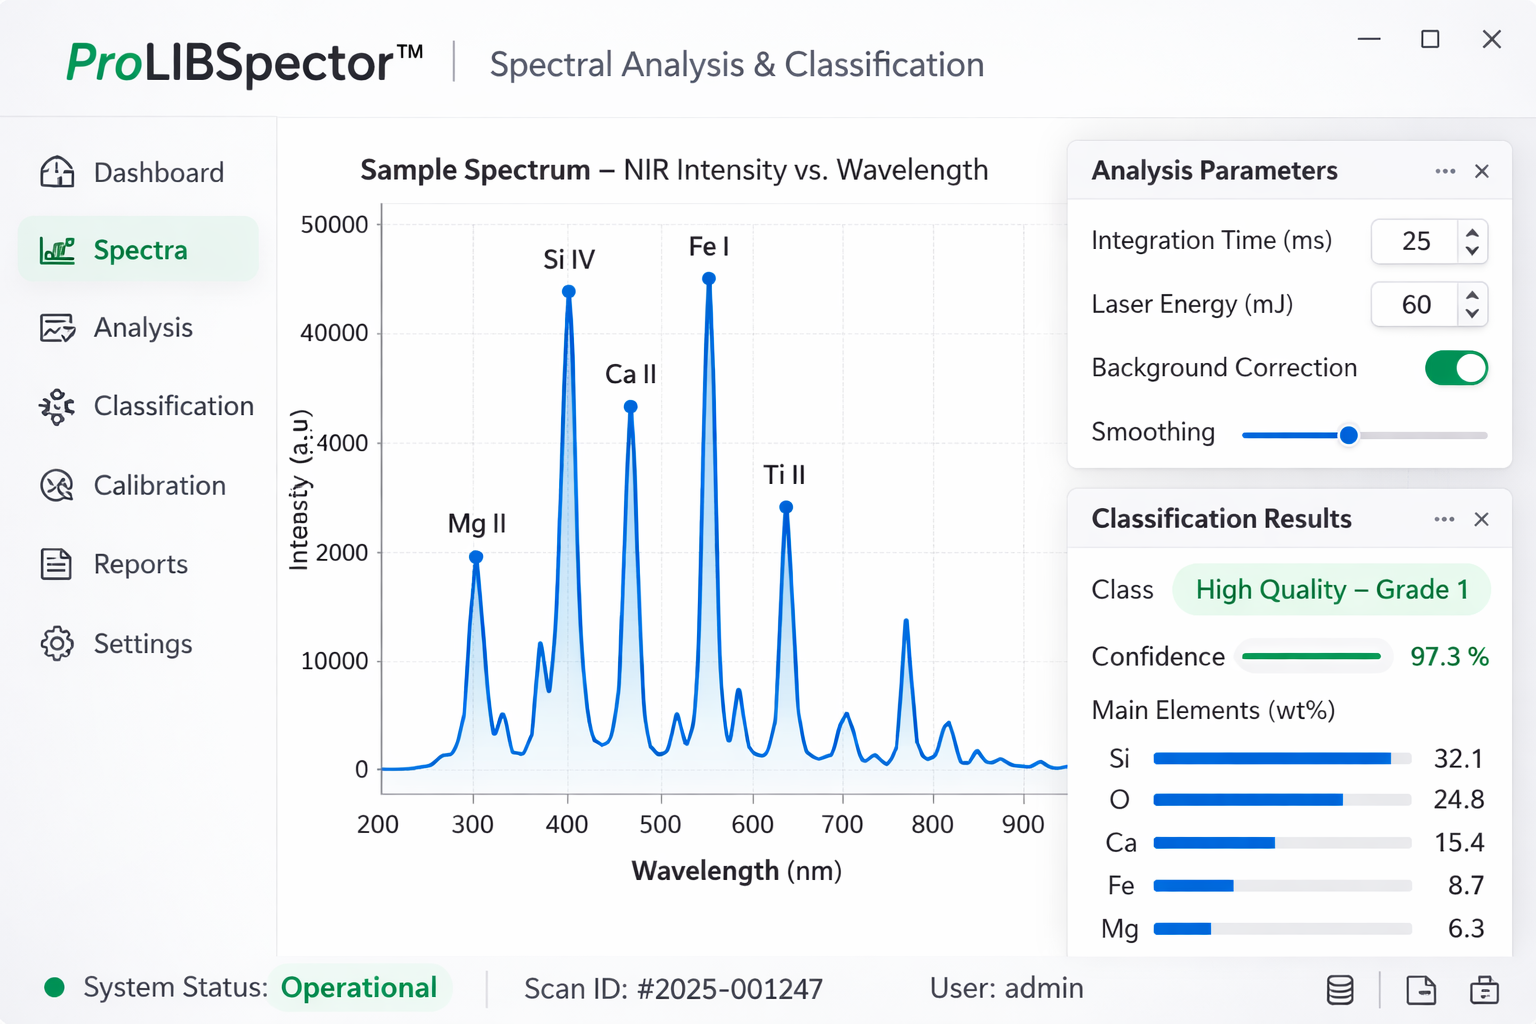
ProLIBSpector HMI software
ProLIBSpector™ HMI Software
Laser Classifier HT automated system
Laser Classifier™ HT
Sample preparation and analysis
Sample Preparation & Analysis

Peer-Reviewed Research Behind Our Technology

The same measurement principle and the same supervised classification approach, applied to biological matrices that have almost nothing in common with each other: coffee bean, cigar leaf, citrus phloem, insect vector, fossil resin, prostate tissue. Each one peer-reviewed. That breadth is the argument for the platform, and it is why the application areas above are not a roadmap.

🎯
Origin Identification
Coffee, Tobacco, Amber
🦠
Disease Detection
HLB in Plants & Insects
🧬
Biological Classification
Varieties & Genotypes
🔬
Tissue Discrimination
Cancer Cells
🦟

Insect Disease Detection

LIBS-based bacterial infection identification in insect vectors of Huanglongbing (HLB) disease.

Scientific Reports 2019

Laser-Induced Breakdown Spectroscopy (LIBS) as a novel technique for detecting bacterial infection in insects

Killiny N., Etxeberria E., Ponce Flores A., Gonzalez Blanco P., Flores Reyes T., Ponce Cabrera L.

🍊

Plant Disease Detection (HLB)

Rapid identification of HLB-infected citrus plants through phloem analysis using LIBS.

Applied Optics 2018

Rapid identification of Huanglongbing-infected citrus plants using laser-induced breakdown spectroscopy of phloem samples

Ponce L., Etxeberria E., Gonzalez P., Ponce A., Flores T.

Coffee Variety Classification

Spectral differentiation between Arabica and Robusta coffee varieties.

Optics and Photonics Journal 2017

Laser-Induced Breakdown Spectroscopy (LIBS) Applied in the Differentiation of Arabica and Robusta Coffee

Diaz Guerrero A.M., Ponce Cabrera L.V., Flores Reyes T., Ortega Izaguirre R.

🚬

Tobacco Origin Classification

Quality control and geographic origin identification of handmade cigars.

Applied Optics 2015

Laser-Induced Breakdown Spectroscopy (LIBS) Quality Control and Origin Identification of Handmade Manufactured Cigars

Alvira F., Bilmes G.M., Flores T., Ponce L.

🔬

Cancer Cell Detection

Fast detection of prostate malignant tissue using multipulsed LIBS.

Revista Cubana de Fisica 2022

Fast Detection of Prostate Malignant Tissue by Multipulsed Laser-Induced Breakdown Spectroscopy (LIBS)

Ponce A., Flores T., Ponce L.

💎

Amber Classification

Analysis and classification of amber samples using LIBS and chemometric methods.

Revista Cubana de Fisica 2023

Analysis of Amber Samples by LIBS and Chemometrics Methods

Flores T., Alvira F.C., Ponce A., Ponce L.

Every study above used LIBS combined with supervised classification models. That is the same core methodology running on Laser Classifier™ today, on both instruments, for seed and for everything else.

Initiate a Structured Pilot Evaluation

Laser Classifier™ is introduced through a structured pilot engagement designed to evaluate seed-level classification performance using your defined samples. This is a formal technical evaluation, not a demonstration or free trial.

📋 Standard Pilot Scope

  • One defined seed type or species
  • Two to three predefined classification groups
  • Controlled sample size (typically 100–300 seeds)
  • Single-pulse seed-level elemental acquisition
  • Supervised classification model development
  • Cross-validated statistical performance assessment
  • Structured technical review session

📊 Deliverables

  • Classification accuracy metrics (accuracy, precision, recall)
  • Confusion matrix and validation summary
  • Class proportion analysis
  • Defined decision-threshold evaluation
  • Technical interpretation of results
Technical review session, analyzing classification results

Ready to Evaluate?

Discuss scope, feasibility, and objectives with our team. Decision-ready results delivered under controlled conditions.

Or email directly: info@ontekollc.com
Olive Branch, MS, USA
863-521-8998
4–6
Weeks — Sample to Report